People tend to treat omnichannel as an asset and the next big thing. There is also an admission that omnichannel is somewhat an enigma. If it is an asset, it is still so much a "diamond in the rough" that retail companies, software providers, solution providers and system integrators - all are struggling hard to figure omnichannel and nail it.
Truth be told, I feel that omnichannel is not an OPPORTUNITY, it is a LIABILITY. Until someone builds a product that can provide the seamless experience that omnichannel purports to provide, I will like to plead that it is just a hype.
I like to use a short story to explain this. A man had one watch, he was very happy looking at the shiny thing that told him time, every now and then. His experience was fantastic - all was well.
Then, we give him another watch. Now his focus moved away from using it to get time. He started focusing on why there was discrepancy between the two watches. However much we tried, even the seconds discrepancy looked egregious and nagging to him. His whole customer experience turned tardy and he wanted us to sort it out. So now instead of thanking us for giving him two watches, he was pissed that there is a few seconds' discrepancy between them. So much so that we was ready to throw both watches that we gave them and move to another guy who promised him just a single watch.
So, we now had a new challenge - how could we make both the watches so good, their alignment so smooth, their time so much in sync that the man would have a very seamless experience.
Omnichannel is much like that - in the beginning of time, companies had retail brick and mortar stores and everyone was happy. Then this thing called "internet" showed up. There were some who said "we will sell things only through internet". Great - they were lucky. People called them Ecommerce guys, online retailers and so on.
The original brick and mortar guys got greedy - they said "why can't we get on to internet?". Companies like Infosys, TCS, HCL jumped at this and assured the brick and mortar retailer that they could definitely help it get on internet. The retailer got on to internet thinking that he would start eating the ecommerce guy's lunch.
The technology provider created another channel for retailer to make money. Everyone was happy. Then customer - let us call her Mary - who suddenly got exposed to the second channel started getting frustrated when the online channel of the retailer didn't recognize her despite the fact that she was spending so much in its stores. She understandably was just asking them to identify her as Mary whether she went online or she went in the store to do shopping. She started expecting world of the retailer but the experience was nowhere near that. In fact, most of the time, it seemed as if she was dealing with two different companies when in reality she was simply dealing with the two channels of retailer.
The retailer went to the technology vendor again. Vendor was lost, scratching their heads they decided to go to Guru of Gurus - Mckinsey. After much pensive introspection, Mckinsey came out with the term "multi-channel" that morphed itself into "omnichannel" with the passage of time.
Omnichannel was carved out as a huge opportunity. People created picture perfect view of omnichannel, but just on paper. There were questions on how to translate the paper view into practical technology.
At a high level, Omnichannel is merely three things:-
1) Profile persistence (of the customer)
2) Shopping cart persistence (of the customer)
3) Transaction persistence (of the customer)
If any technology vendor can make a tool or product that allows these three things to come together, we will immediately have omnichannel experience. It could be next big idea for a startup. However, it is easier said than done. Persistence means that data has to synced between different systems in almost real time manner. That means there has to be real time data integration between systems. In the absence of that, the persistence becomes batched and delayed updates to the backend system and therefore loses its meaning.
In the absence of such tool or product, omnichannel remains as much a pipe dream for retailers, as it is a massive liability for them. Customers are unhappy that retailers don't recognize them well enough when they move from channel to channel in the realm of the same retailer.
Meanwhile, the original ecommerce guys like Amazon, Wayfair and eBay are having time of their lives - enjoying the sunshine since all they need to do is - worry and focus on one channel and make it the best.
Tuesday, June 17, 2014

Wednesday, May 21, 2014
The Three Sciences of Ecommerce
Ecommerce and Retail are exploding. In 2016, ecommerce and
retail has been projected to be well over $ 1.6 trillion dollar industry. Intersection of Ecommerce and
Retail and Big Data is the most happening intersection. People who are showing
up at this intersection may not perhaps be fully aware but they would be
considered pioneers many years from now.
Big data can make special play for many areas of the ecommerce and retail domain but there are three areas that are emerging as separate fields
of full blown sciences in this space. They are Customer Science, Logistic
Science and Pricing Science.
Customer science is likely to manifest itself in such huge dimensions that it is likely to touch almost every aspect of the business. One way to measure the success of this science would be to relate this science to best customer experience. The science will be all inclusive, in that, it will be super set of intriguing sciences like
personalization, targeting, loyalty indices, Omni Channel experience,
micro-segmentation, data driven experiences customization. All these sciences will be brought to give every customer a feeling of the store or online website created and tailored specifically for that customer. What can be better than that experience and walk away with a feeling that the specific store was opened and merchandized only for me? Nothing can top this. In essence, all these component sciences are becoming “need to
have” as opposed to “nice to have” component sciences for Customer Experience.
Since the start of the commerce in history, price has played - whether
it was barter based as in the medieval times or currency based as in the modern
world - a very significant role in purchasing decisions in buying
and selling trade. Therefore, it is natural that pricing science is assuming
prominent and almost keystone attention. Pricing science is likely to include
but not necessarily limited to price optimization, price modeling, location
based pricing, “cheap NOT EQUALS good” strategy. MBA courses devote special focus on
pricing. Big data analytics and predictive modeling are likely to give this
special impetus.
Logistic science is again an all-encompassing term that includes
Predictive Inventory provisioning, real time inventory and supply chain
visibility, optimized shipping, supply chain analytics, feedback loop, cost
optimization, demand prediction modeling and single view of demand. For those
who live and breathe logistics in retail and ecommerce world, it is always
clear that this is the space where we can get maximum cost optimization. This “taking
out the cost” from operational expenses is the best optimization that a Etailer
can do. It is also cheapest amongst all other ways of bringing down Operational
expenses.
People can argue about Omni-Channel being the fourth science
– however, I refuse to add that to these three majors. I had rather club
omni-channel as part of customer science since, in the absence of customer
experience, omni channel is just bunch of technologies designed to exist and
operate in cohesive manner. It is customer science which provides the real
value for omni-channel.
Though the price wars, over-store’ing in US as well as
burgeoning foreign (read, Chinese) debt is going to make life brutal for
retailers and ecommerce companies, it is also going to be the most happening
space in coming years.
Sunday, May 11, 2014
A Centralized Team aka “The Only Grocery Store in the Town”
What are tenets of a centralized team? First off, what does
that even mean? Centralized teams are those that provide “Horizontal support” -
implies that the team is not providing support to one specific domain or parts
of business, instead it focuses on supporting all teams in a very generic manner. The support
then takes the shape of becoming a service as opposed to being a domain
specialized niche service.
There are pros and cons of moving away from being a niche
service provider to being a generic service provider. One obvious upside is
that the team develops a “cookie-cutter” type of solution and uses the same
solution to service any and every line of business. The downside is that this
is detrimental to the team members themselves. They lose the touch to
understand nuances of each domain. Their expertise is diluted to a point that
the service would devolve into a commoditized service.
Typically, in most companies of reasonable sizes, teams such
as network operations, database administration, system and storage administration
and data center have the opportunity to assume the role of central teams and provide horizontal support.
Why are such teams formed and kept as central teams? There
are multiple reasons for that. For one, a central team has a critical mass so
it can be administrated as a team as opposed to “onezy-twozies” who are
existing as differently skilled persons in a team of largely varying skilled
resources. Then there is question of performance appraisals - this becomes easier since you can compare “apples-to-apples”.
The career paths are clear – you can have a clear career path within a team of
10-15 system administrators as opposed to one system administrator residing in
a team of developers. This is the high order bit of why central teams are needed.
If we want to double click on details then, from logistic standpoint as well, it becomes easier – you can restrict superuser passwords, sysdba, system passwords etc within the team and don’t
have to share it across multiple teams and lose the notion of password itself. Finally, best practices are very well shared, standards are
set and implemented. SLAs are drawn and people have set expectations on the type of “customer
experience” for a given task.
When we combined the DBA teams under one umbrella in 2009 –
after trying for many years – I realized that there were more leaders,
especially those whose DBAs were being “snatched away” from them, who wanted
this model to fail than those who wanted to see it successful. So there was a
political realm to the whole implementation. While one part of the management chain
wanted this to happen, the other part was doing simply window dressing by
playing along in meetings and using every miss by central team to highlight the
fact that it was a failed implementation.
Then there were DBAs who were behaving as if they have been
uprooted from their comfort zone and were struggling to find their roots in the
new land. They were still attached with umbilical cords with their previous
organizations and wanted to restore the status quo. This behavior can largely be explained as a sole fish or few fishes falling into a bigger pond and
being scared, loaded with skepticism of how things will pan out.
As is fairly apparent by now, there were struggles, external
as well internal, to nuke the central team even as we had just started forming
up.
Most of the external fears and misconceptions were very reasonable – for example, will the service levels dip, will the team get same focused
support from their earlier DBA or will that DBA’s effort spread thin across
multiple other domains, will team get new DBA to interact every time so they have to end up teaching from scratch, the idiosyncrasies of their domain to the new DBA. However, it would be naive to say all of the opposition to move towards central team was based on above reasons only - there could be the omni-present sense of "loss of territory" coming into play as well in that opposing behavior
While all this was happening, I became convinced and
somewhat determined that if we have to be successful as a central team, we need
to behave as follows:-
Imagine that you are
the only grocery store in the town. By being the only place where people can
turn to for their groceries or go hungry, it becomes important that following
tenets be followed:-
- No Customer Turned back – we can’t turn back any partner team for whatever reason – least of all due to things being out of stock or not enough salesperson to provide customer the service (akin to lack of bandwidth).
- Queue system established – we will have to establish a queue system that gives a sense to the customer when will he or she gets the attention of salesperson.
- Length of queue (or wait period before service) is reasonable
- Service is provided with quality
- Service is provided with a smile (because you love to do business with friends)
Luckily, we had a very mature leadership team in place. We had discussions within leadership team that we will do our utmost to make this successful. We ensured that we would provide the best service to all our partner teams including the new teams that we absorbed into our teams. This was more of journey. Over a period of consistent engagement with us, the “noise” generated by external partner almost died down and was replaced by a sense of “we are better off now”.
There will always be people who for their personal interests
will go against the grain of centralization. At some point, it is better to
make the right call on those. There have also been team members who came from external teams who have turned
out to be exceedingly better than our existing team members.
What happens if you fail to follow the tenets?
Most of the times, central teams walk away with the arrogance
and impression that people don’t have choices and they will do whatever we tell
them. When that happens, customer teams tend to behave somewhat
analogous to flows of rivers. Like a river figures out path of least resistance and eventual flow, a partner team not getting required
service from the central team tends to eventually figure out how to find that
support. They will devise a way to get that service – in most of the cases, the
solution will involve seeking help from teams outside of central team, forming
their own team, engaging with an external vendor to outsource their support
needs. All this leads to undermining and ultimately destroying central team, so it is always in the best interest of the central team to behave like the "only Grocery Store in the town" and follow the tenets mentioned earlier.
Wednesday, November 13, 2013
You Know Your Company Has a Data Problem When......
·
Your
Business users don’t know where the data is stored...
·
Your
data warehouse system lead doesn't know the name of data warehouse DBA's
·
A
key customer is lost and no one knows why
·
Scarily
large number of meetings are held to decide which data source is more accurate
·
Two
reports about same metrics from two different data source give different
picture
·
The
impact of a key customer campaign is known only to one sales person who is on
vacation the day campaign runs (or crashes)
·
To
get simple report, you have to submit a bug ticket
·
A
report of a customer campaign shows up days after the campaign
completes
·
The
question “how many customers we have” gets you different answers
·
The
question “who are our key customers” gets you “deer-in-front-of-headlights”
expression
· Centralized Metadata??? Duh?
·
Business
decisions are taken on “I think so…” logic
·
Each
department wants to create its own marts and data warehouses
· DBA's have no idea about purpose of their data warehouse but DB size is a bragging point
·
Getting
older data is like asking Santa for a Ferrari……
·
No
one has clear idea about who uses thousands of reports
·
Retirement
request for old, never-used data warehouse is met with “…I don’t know, we get “lots” of reports….”
·
Data
policies are not written
·
Data
governance is non-existent
·
Data and Strategy are oxymoron terms
·
Data
is not viewed as an asset
·
Data
quality is major project
·
“Flying
Blind” is considered an adventure….
· Visualization is more important than data correctness
· Data and data people are given second class citizenship….
· Visualization is more important than data correctness
· Data and data people are given second class citizenship….
Saturday, September 14, 2013
"Where do you want to be 5 years from now?"
Many times, I have been challenged with the clichéd career
question – “where do you want to be 5 years from now?”. Most of us when posed with this question make the mistake of somehow boxing ourselves in the current company, industry and domain. For example, I can easily think of myself as where I will be five years from now and sure enough, I will limit my thoughts to being at Yahoo, even after 5 years from now. I would try to hold a crystal ball and forecast that I would be doing such and such thing at so and so position and role. Not many of us do think that this may entail leaving our current job, company and domain and be doing something else. We can't even forecast how many jobs we will hop or change in these five ensuing years.
I didn't really pay much
attention to the underlying actual theme until I had a very good and somewhat
scrutinious discussion with Mark Morrissey, our SVP of Production Engineering
at Yahoo. Another person who help ignite this discussion with his insights is
Sarang Kirpekar, DVP, Sears Holding and a very good friend. I thank both these gentlemen for their insights into this discussion.
I realize that as you are growing in your career – it is
likely that first few jobs are spent in wilderness. You are very lucky if you
are Mark Zukerberg, David Filo, Jerry Yang, Larry Page, Sergey Brin and so on.
For, then your first job is your last job as well. But most of us meander and
waver through first few jobs and then land into something that we consider our
calling. For example, you may work for a web hosting company, then a clinical
trials company and then land up at some stage in an Internet company like
Yahoo.
While you are traversing through these peaceful first few
jobs, your focus is primarily on gaining your technical skills. These skills are in your
domain – your domain could be DBA, programmer, system administrator etc. So you
join as novice DBA then transition to junior DBA. After few years and hard
work, you get to call yourself Senior DBA. Few more years under your belt and
you call yourself a DB architect. Yet few more years, you start considering
yourself the best thing that happened to databases since Oracle 6.0. Sure, not all have that big an ego and vanity. :)
I call this specific period of gaining your chops in
technical domain as X Axis or horizontal skill band. I also call this as your
first love. Ok, not first love but, at least, second love.
While traversing through this career land, you also navigate
through multiple vertical domains – retail, ecommerce, health or internet etc. While
moving and learning nuances of each of these domains, you fall in love with one
that challenges and excites you the most. You may also end up calling this as
your third love.
I will refer to this as Y axis or vertical domain band.
Once you have discovered both X and Y axes for your
professional life, it is like you have arrived. Yes, it is indeed that. You
have now got hold of your x and y coordinates of professional life or at least
handles that will enable you to take your career further.
I also call this discovery as “discovery of professional graticule”. Be glad if you are able to achieve this - Why? Because many of us pass through professional life without having discovered or achieved
this professional graticule. Without this, you are like a rudderless ship which may have immense horsepower and steaming ahead on all engines, alas, without accurate directivity!
Hopefully you are not one of those unfortunates and have discovered your professional graticule. Once you have discovered your professional graticule, the
professional journey is very easy. All you need to do is move the horizontal bar on vertical scale making your graticule move up. I have tried my best to
summarize this in following diagram.
 |
| Professional Graticule |
As you grow in your career, remaining within your professional graticule,
the professional graticule box progresses. For example, from a manager through
director and finally to an SVP, this professional graticule marches on as shown in the figure below.
 |
| Progress in your domain via your professional graticule |
Sometimes there are small setbacks. These setbacks are due to your desire to
chase money as opposed to professional excellence. So you end up taking a pay
cut, throw away your rank & standing and join a startup. Nothing wrong with
that. It is just that during this period, your forward march on a graph seems
somewhat arrested – it may well be compensated by the forward march in your
bank balance, so no complains J.
What is the point I am trying to make in this discussion?
The point is very simple and somewhat obvious – the sooner
you discover your professional graticule the better it is for your career and
professional life.
Like I said earlier, many a professionals pass through an
entire professional lifetime wandering from one job to another and in the
course of that journey going through different vertical domains. Some people, like Jack
Welch, may call this “all round development” but I call this as plain journey into
being an executive as opposed to being a specialist. GE is one company that
still encourages its leaders to become good executives by having gone through
the myriad rungs of leadership in various industries in GE’s portfolio.
Navy also somewhat encourages that – you command surface ships
– graduating from smaller missile boats to missile corvettes to frigates, destroyers
and cruisers (in that order, perhaps) and then if you are lucky, command a battleship
and an aircraft carrier before becoming fleet commander and eventually Naval
chief.
I am of the opinion - and you need not really take it as the best of the option - that one should figure out one's professional graticule and then focus all his or her energy on that graticule and growth in that X and Y intersection. This gives you the most positive growth since you are very directional and not really meandering from one career to another.
In one case, you are “Jack of all, master of none” and that
is perfectly acceptable and understandable. In another case, and where you stay
in your professional graticule, you tend to become “jack of one and master of
that very one”. Pick your choice!
Saturday, September 7, 2013
Big Data - Background from a Time Traveler
Count me in as the
biggest cheer leader of Big Data bandwagon. I agree, it is very ironical if you
know my background. Some will call me traitor
as well, especially those that are more loyal to Oracle and other flavors of RDBMS than Oracle corp itself is.
For years, even during the days in the Navy, I was Oracle's huge
protagonist. Oracle DBAs could be singled out in the crowd - the guys who wore
their attitude on the sleeves and a pony tail to back it up. Oracle and Uncle
Larry could do nothing wrong. Those were really the heady days when Oracle was
leading head and shoulder ahead of the rest of the pack.
To top it all, around
2005 or so - Oracle 10g made its debut and Oracle RAC (Real Application
Cluster) grew beyond 9i's infamous oracm cluster software and into a much more robust crs cluster software.
Everyone was high on Oracle. Oracle could do everything. To the extent, that anything that could
not be done by Oracle should not be even tried in the first place. Why? Because
it simply didn't make sense. Oracle was the pied piper and most of us from
database fraternity followed it blindly. Oracle could do no wrong. In
historical terms, "Sun would never set on the Oracle empire".
However, soon we realized that Oracle was fallible, after all. We had a 130 TB data warehouse on Oracle and this is year of the Lord, 2006, when we suddenly started
seeing SLA misses and performance issues. ETL jobs would take enormously long and then Reporting jobs would run endlessly. For more than six months,
many ace DBAs, Network administrators, Storage Gurus, SysAdmins and Engineering
architects broke their heads - many a times at the verge of killing each other
but every time we brought the system to a good state, the data volume would push
the envelope and we would see the SLA misses. It was as if our destiny was taunting and teasing us. The cycle would just play itself again
- encore!
We were hoping Oracle development team will add more punch to the RDBMS software. But Alas, Oracle did almost nothing - they would not even take a look at DBMS_SCHEDULER (Oracle Native job scheduler). The scheduler was woefully short in handling special needs of data warehouses - no way to provide resources allocations, prioritize SLA over non-SLA jobs, re-nice job priority, and so on.
It almost felt that we were left with under-performing weaponry and left to fend for ourselves at the mercy of far superior enemy, the Big Data explosion.
We were hoping Oracle development team will add more punch to the RDBMS software. But Alas, Oracle did almost nothing - they would not even take a look at DBMS_SCHEDULER (Oracle Native job scheduler). The scheduler was woefully short in handling special needs of data warehouses - no way to provide resources allocations, prioritize SLA over non-SLA jobs, re-nice job priority, and so on.
It almost felt that we were left with under-performing weaponry and left to fend for ourselves at the mercy of far superior enemy, the Big Data explosion.
While we were having challenges of our own and were in a very reactive mode, the world was changing around us. Jeff Dean, Sanjay Ghemawat et al decided to play spoil sport and worked out algorithm for Big Table, the distributed computing and storage framework for Google's Search indexing problem.
Since Yahoo was also in the business of Search (this well predates the search-deal-with-Microsoft days), Yahoo decided to look around and find its own man Friday. Doug Cutting turned out to be "da man". He was working on Nutch and was trying to implement his own version of Big Table, perhaps using the same schema family.
Doug Cutting, Mike Cafarella (then an intern but now a very famous professor in Univ of Michigan, Ann Arbor) and team were, meanwhile, working in the background on this alternative which would almost immediately provide panacea to all our problems.
They took sometime to get their work out of the door when, Hadoop, as we know
it, was born. Named after toy elephant that Doug's daughter had, Hadoop was, au contraire, no toy - it was the giant beast who easily bested
Oracle even while it was barely born.
We created our Hadoop clusters in Yahoo - first as research and development grids and then production grids. The developers within Yahoo reacted to Hadoop's emergence as if shepherds heard the news of Jesus' birth from Angels. Almost overnight (slight exaggeration), we saw most of the event level aggregation jobs moved to Hadoop grid. The baby elephant easily beat the hell out of seasoned Oracle software. The jobs that would take 9 hours on a 10 node Oracle data warehouse started completing in less than an hour. The developers had tasted the first blood, there was absolutely no turning back.
We created our Hadoop clusters in Yahoo - first as research and development grids and then production grids. The developers within Yahoo reacted to Hadoop's emergence as if shepherds heard the news of Jesus' birth from Angels. Almost overnight (slight exaggeration), we saw most of the event level aggregation jobs moved to Hadoop grid. The baby elephant easily beat the hell out of seasoned Oracle software. The jobs that would take 9 hours on a 10 node Oracle data warehouse started completing in less than an hour. The developers had tasted the first blood, there was absolutely no turning back.
We could neither see
nor understand what Hadoop was doing for us and the rest of the world. It had
ripped off the ceilings, limits and shackles that relational databases had imposed on us
for a long time. This freedom was most welcomed by those in analytic world, for
they were emancipated suddenly. They were stunned by insights they could get
from Hadoop based processing and data. The age of Big data was upon us. However, it would be sometime before the term "Big Data" would come into being.
Analytic fraternity
suddenly realized that there was nothing to restrict their imagination except
limitations of their own competence and flaws of their mind. The world of
Analytics and ware houses would never be the same again.
What Jeff Dean,
Sanjay Ghemawat, Doug Cutting and many others who followed them did - whether
knowingly and deliberately or unbeknownst to themselves - they had unleashed
upon us the age of Big Data. I would certainly say that these were the people
who should be called the fathers of Big Data.
Meanwhile, we, the
loyal Oracle DBAs, were generally in
denial or ignorant phase. What is this phase? It is believed that any new
technology has at least two different reactions from its target user base.
There are those that are new to both existing (aka older technology) and new
technology or product. For them, new is better - they immediately take to new
technology as fish takes to water.
The second user base
is those who are deeply entrenched in older technology or product. For them
learning something new is like giving up the handicap they have over these
newbies and learn the new technology afresh. So there is a reluctance….Now let
us take the view of those that are heavily invested in existing or older
technology - these people hate the new technology - they had much rather that
new technology just goes away and vanishes. Perhaps they go to sleep wishing
that every single night. They are likely to pass through following phases:-
Phase I - Ignore the existence of new technology.
Phase II -Luke warm acknowledgement
Phase III -Continue to push old technology with more Ad/Marketing dollars
Phase III -Continue to push old technology with more Ad/Marketing dollars
Phase IV -Create FUD (fear, uncertainty, doubt) related to new
technology
Phase V - Run behind
the charging caravan and see if they can catch up
 |
| Phases of Learning |
The believers of old
technologies actually end up providing use cases and some type of quality
assurance testing for new technologies. How? They keep pointing to flaws in the new
product and technologies and developers of the new technology continually remove and resolve those issues.
There were few
enabling things happening at the same time when Big Data containers were being
invented. Smartphones like Palm Treo, Blackberry followed by iPhone and
Android devices were showing up. These smartphones and devices had started pushing the limits on data volume that was being generated. In turn, the backend data
containers started bursting at the seams. So to a time traveler, who is now blessed with the power and wisdom
of hindsight, it would become clear that right at the moment these hadoop processing and data containers
were being invented, people were already waiting with tons and tons of data to
pour in. So, in somewhat naive sense - Hadoop and its cousins like Big Table, DynamoDB, NoSQL systems - these systems and technologies were put in
production before they could even enter beta phase.
Just so that I keep
this discussion honest, I want to assure that I not moving the timelines even one bit. Around 2009, I saw the
"light on the mountain" and got "converted" - we realized
the power of these new technologies and what they were doing to analytics and
insights world. Meanwhile, many in the world were still perceiving Big Data as a
hype.
I suspect the dust settled around 2010 or so. People realized and surrendered to the real power of Big Data. It was also realized that this was not a hype like "Y2K" - it was hear to stay. Companies have not looked back in the race to push data into these new data stores since then.
What are the different things being dumping into the Big Data containers? Let us take a look at a small sliver of the total data generated online (figures as of 20101, data courtesy - DOMO.com -http://www.domo.com/blog/2012/06/how-much-data-is-created-every-minute )
I suspect the dust settled around 2010 or so. People realized and surrendered to the real power of Big Data. It was also realized that this was not a hype like "Y2K" - it was hear to stay. Companies have not looked back in the race to push data into these new data stores since then.
What are the different things being dumping into the Big Data containers? Let us take a look at a small sliver of the total data generated online (figures as of 20101, data courtesy - DOMO.com -http://www.domo.com/blog/2012/06/how-much-data-is-created-every-minute )
- Email users send more than 204 million messages
- Mobile Web receives 217 new users
- Google receives over 2 million search queries
- YouTube users upload 48 hours of new video
- Facebook users share 684,000 bits of content
- Twitter users send more than 100,000 tweets
- Apple receives around 47,000 application downloads
- Brands receive more than 34,000 Facebook 'likes'
- Tumblr blog owners publish 27,000 new posts
- Instagram users share 3,600 new photos
- Flickr users, on the other hand, add 3,125 new photos
- Foursquare users perform 2,000 check-ins
- WordPress users publish close to 350 new blog posts
We recognize all
these companies as big data players - they are "spewing" all this
data into some storage, somewhere so they can make better sense how people are
using their products, refine those products, make them further attractive for
users, in turn accept more data from more users and continue on the kaizen path or path of continuous improvement. Of course, this improvement comes with
underlying vested interest of finding some way to better monetize the products
- if not today, then at least some day in future.
This data generation
is leading to "data pollution". Why do we call it data pollution? In
the absence of great tools to store, process and make sense of this data, we
are just involved in a good model of trucks of data loads being shipped from one
system to another, one datacenter to another, one container to another. There
is a hope in every mind that is involved in this transportation "value
chain" that someone else knows how to extract value out of this data.
There is also a faint hope that "somebody" knows extremely well what
is going on.
In short, we are
clueless but hope somebody better know how to make sense of this.
There is virtually a
"data race". Data size is a good bragging point for storage folks,
Database administrators and data community at large. Without good and
meaningful analytic hovering over big data volumes, the big data is really of
no use to man or beast. In fact, I would call it terribly expensive
"garbage dump" if you are storing huge data but not getting
meaningful and actionable insights from it.
I will cover further
on Big Data enabling technologies that are the "partners in this
crime" in my next blog.
ErrorDB - a Case for Robust Error Handling Platform
While people love to hate Oracle, there are few things
Oracle does exceedingly well. Or let me be more specific – there are few things that I personally love in Oracle core RDBMS.
One of them is the standard error messages that we use in
Oracle. The messages are very standard and there is a very good coding mechanism
for coding different messages from different layer of Oracle. Let us take a look
at different codes that Oracle uses for sending error messages to the users of
Oracle. Oracle has almost 50 plus such categories, below are only those categories that are typically seen by DBAs in every day life.
·
- ORA-00000 to ORA-62001 – Oracle Core RDBMS problem
- EXP-00000 to EXP-00113 - Errors related to Exp (data export utility)
- IMP-00000 to IMP-00401 - Errors related to Imp (data import utility)
- SQL*Loader-00100 to SQL*Loader-03120 - Errors related to SQLLDR(data loader utility)
Why Oracle uses these error messages? Simply because Oracle
wants all people to understand and talk in common language. So when Satoshi
Ikoma, a DBA in Tokyo, Japan, who doesn’t understand English as well as Jim
Corbett, his company’s DBA in San Francisco, California gets an error “ORA-01555:
snapshot too old: rollback segment number 007 name "UNDOTBS-04" too
small”, he understands this exactly as Oracle intends him to understand it
despite the fact that he doesn’t understand English as well. The error means same thing to both Jim and
Satoshi San despite the fact that both of them are at different level of
competence over English.
If you whisper ORA-00600 (Oracle Internal errors for the
uninitiated ones) in a DBA’s ears who is in deep slumber, perhaps after unmentionable
number of beers, you can get him to immediately jump, sober up (to sobriety tests
totally passed) and almost hyper ventilating.

ORA-00600 Message
Why can’t we use the similar error reporting mechanism for our
applications? The error reporting mechanism in some applications is somewhat
mature but most of them have very “intuitive” error messages, like 0, 1 or 2.
When a service engineer or operations center duty person receives
an alert stating “EDW job 4403 errored out with error -1”. This means that
either the service engineer starts digging around in knowledge base documents
to figure out if someone has been kind enough to mention what -1 means or he starts praying that God miraculously dawn him the wisdom to figure out this error code.
Like I said above, many applications are far ahead of others on this
curve. They not only report a very informative error message but also have
different coding.
How can we have all the applications to follow a very loose
framework which also becomes a platform?
Creation of an error reporting platform could be our answer.
Imagine if we have a something like ErrorDB. It could provide a
framework that applications could use to register their application with. Once
registered, the applications could use meta data tables within ErrorDB to
insert rows for each error the application can throw. ErrorDB can perhaps be like RolesDB, nodereg or CM3 or any other platform that can be used by all applications in an organization.
The application error could have following:-
The application error could have following:-
- Application Error code
- Description of the code
- Suggested resolution code
The ErrorDB application could provide APIs to register, set, get error codes which applications could then use to show error in somewhat better and user
friendly message.
ErrorDB could also have a CLI that could be used by service
engineers who are more geeky than normal users.
Having a very mature ErrorDB will allow people who are
supporting the applications to understand and learn application almost
instantly. There is no “blackbox” left thereafter.
Troubleshooting an issue
will be so much better. We won’t need “exorcists” to come and wave the wand to
figure out the issue. In other words, diagnostics becomes very easy and simple.
It would also improve operability of the application. Developing
an application that is always enigma for not only for support engineers but
also many a times for the very developers that developed it. It may satisfy
someone’s vanity but it leads to wasteful human cycles.
Extending the application becomes way easier when the error
codes are easy, decipherable and remediated.
Gap Maps - Great Way to Measure Product Operations Maturity
Often, people connected with a product wonder where their product is in comparison to other similar products or competitors, so to speak. The management gurus figured out a way to bridge that by creating “Gap Maps”.
The great thing about gap maps is that they can be used for comparing any entity. The entity can be products, sports teams, presidential candidates, tools, countries, choices…..anything at all.
The way you do it is to find two determinant attributes – two very distinguishable and principal attributes that define the set of entities. To explain this further, I take my favorite example – if I want to buy a new car, I could have mileage per gallon and MTBR as two determinant attributes. I could also have “smell of new car” as one of the determinant attribute. Though it is very endearing thing, the new car’s smell is certainly not very good attribute to go by, especially when you are putting tons of money down on a car.
Moral of the story – the gap maps are just a tool. How reliable it would be depends entirely on your choice of attributes. It is classic case of GIGO (Garbage in, garbage out) – if you chose the right attributes, you will get good gap map, bad choices will lead to bad gap map.
Why we need to get a good gap map? Simple reason is that a good map unravels so many stories about your product and similar products (read competition). A bad gap map may sweep under the rug many of the flaws and may lead you to believe that you have a winner product.
Now, this is one part of the story. Hold this strand somewhere in your L2 cache while I do a context switch.
Let me start another thread in this story and see if I can bring multiple the threads together to weave a single story, at some point in this blog.
We had gone live with a product earlier this year. It is one of our Data Systems pipeline that carries data (aka events) from hundreds of thousands of serving hosts back to our own “Deep Blue” backend system which then takes this petabytes of data and makes sense out of it.
Before we went live, we did something called Operational Readiness Certification or ORC. ORC is a long laundry list of hundreds of questions – some require subjective answers, some need numbers and yet others get Boolean type answers.
A good example of question asked in ORC is – “Do you have a BCP” – the answer is pretty Boolean – Yes or No. (Ok, there will always be the *cautious* types that will start their answer with “It depends…..” LOL!)
So this pipeline had passed ORC with flying colors and everyone was happy. However, when we started ramping up the volume, we found three conspicuous challenges on this pipeline:-
Each of these three was causing us to throw tons of manual cycles at it with no light blinking at the end of tunnel. There was no ready metrics that we could take to our product and engineering partners and tell them where this product was in terms of production readiness and where we would want it to be.
It was a perplexing problem and luckily for us our Dev team is very brilliant who didn’t really need us to put lot of data behind these three issues before they would even pick them up for resolution.
So what was the problem statement? In a very high level, bulleted version, it would look something like this:-
As I said above, we are lucky to have great developers at Yahoo and within a quarter, we almost solved all the three problems. However, lack of a good measurement method or absence of a tool that we could use to evaluate and compare our product with similar and very mature product in that space frustrated us.
Now let me bring in the third string in this story. I was reading a book on product management where the authors discuss gap maps and it dawned on me that if I have something similar, we could use it to compare different properties at Yahoo that we support.
Bringing all different strands together, I decided to look at gap maps, used for decades in the product management industry, to evaluate and compare our different data systems pipelines. The first and foremost challenge was to figure out correct determinant attributes. The challenge was that there are so many great attributes that could be used to peel this onion. I took a different approach and decided to create two uber attributes with any number of sub-attributes.



The great thing about gap maps is that they can be used for comparing any entity. The entity can be products, sports teams, presidential candidates, tools, countries, choices…..anything at all.
The way you do it is to find two determinant attributes – two very distinguishable and principal attributes that define the set of entities. To explain this further, I take my favorite example – if I want to buy a new car, I could have mileage per gallon and MTBR as two determinant attributes. I could also have “smell of new car” as one of the determinant attribute. Though it is very endearing thing, the new car’s smell is certainly not very good attribute to go by, especially when you are putting tons of money down on a car.
Moral of the story – the gap maps are just a tool. How reliable it would be depends entirely on your choice of attributes. It is classic case of GIGO (Garbage in, garbage out) – if you chose the right attributes, you will get good gap map, bad choices will lead to bad gap map.
Why we need to get a good gap map? Simple reason is that a good map unravels so many stories about your product and similar products (read competition). A bad gap map may sweep under the rug many of the flaws and may lead you to believe that you have a winner product.
Now, this is one part of the story. Hold this strand somewhere in your L2 cache while I do a context switch.
Let me start another thread in this story and see if I can bring multiple the threads together to weave a single story, at some point in this blog.
We had gone live with a product earlier this year. It is one of our Data Systems pipeline that carries data (aka events) from hundreds of thousands of serving hosts back to our own “Deep Blue” backend system which then takes this petabytes of data and makes sense out of it.
Before we went live, we did something called Operational Readiness Certification or ORC. ORC is a long laundry list of hundreds of questions – some require subjective answers, some need numbers and yet others get Boolean type answers.
A good example of question asked in ORC is – “Do you have a BCP” – the answer is pretty Boolean – Yes or No. (Ok, there will always be the *cautious* types that will start their answer with “It depends…..” LOL!)
So this pipeline had passed ORC with flying colors and everyone was happy. However, when we started ramping up the volume, we found three conspicuous challenges on this pipeline:-
- Backlog Catch up Rate
- Reprocessing
- Data Discrepancies
Each of these three was causing us to throw tons of manual cycles at it with no light blinking at the end of tunnel. There was no ready metrics that we could take to our product and engineering partners and tell them where this product was in terms of production readiness and where we would want it to be.
It was a perplexing problem and luckily for us our Dev team is very brilliant who didn’t really need us to put lot of data behind these three issues before they would even pick them up for resolution.
So what was the problem statement? In a very high level, bulleted version, it would look something like this:-
- ORC is great but somewhat subjective and boolean
- ORC is also a matrix of blockers, failures, exceptions, action items. Once you are past those, nothing more comes out of ORC.
- After ORC is done, what is the next step? All products are at the same level.
- No way to classify/score maturity of a product compared to its peers
- No method of comparing different properties
- Comparison of similar systems could help
- ORC doesn’t allow time series trending
As I said above, we are lucky to have great developers at Yahoo and within a quarter, we almost solved all the three problems. However, lack of a good measurement method or absence of a tool that we could use to evaluate and compare our product with similar and very mature product in that space frustrated us.
Now let me bring in the third string in this story. I was reading a book on product management where the authors discuss gap maps and it dawned on me that if I have something similar, we could use it to compare different properties at Yahoo that we support.
Bringing all different strands together, I decided to look at gap maps, used for decades in the product management industry, to evaluate and compare our different data systems pipelines. The first and foremost challenge was to figure out correct determinant attributes. The challenge was that there are so many great attributes that could be used to peel this onion. I took a different approach and decided to create two uber attributes with any number of sub-attributes.

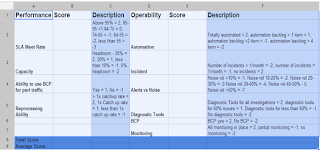
Sample attributes and sub-attributes
Performance and Operability were
the two overarching attributes and each had many sub-attributes.While selecting attributes and
sub-attributes, it should be kept in mind it is not necessary that different
categories of properties have similar attributes. For example, a property like
Yahoo Frontpage or Facebook main landing page may have different attributes
than a backend data warehouse system. Decide your attributes and sub-attributes
carefully and diligently. This will be time well invested upfront in the whole
exercise.Once the sub-attributes have been
chosen, you could use a simple spreadsheet to compute the values for the
sub-attributes and aggregate them to arrive at a value for the parent attribute.
Please see the figure below. I have also given some guidance for scoring them,
but you should create your own guidance.

Scoring spreadsheet sample
The point to keep in mind is that
this guidance should not change from property to property (or product to
product) in the same category. So if you are comparing different data warehouse
systems or massive analytic systems, the guidance should remain the same.
However, like I said above, different categories may have different attributes,
some similar some totally dissimilar and there guidance for scoring may also be
vastly different from the above scoring model.
Once you get the values from this
type of spreadsheet for main two determinant attributes, use those values to
plot on the simple X,Y Axes graphs.
The names of the product are
somewhat fictitious and so is the sample data (I could use the disclaimer “The
characters and story in this movie are fictional and any resemblance to people,
living or dead, is merely coincidental…” J)

Sample Scores for POM
Once you have the values for X and Y Axes,
plotting of the graphs is fairly simple.

POM Graph
Now that you have the graph which
gives where different similar products fall, you may ask the question, now
what?
Well, to start with, you
(developers, Service engineers, product managers, managers – in short all connected
with the product) can understand where your product is compared to its peers.
The first endeavor should be to get
your product to the first quadrant (positive quadrant). Once it is in the
positive quadrant, the next endeavor should be to continually move it to in the
north east direction.
It also gives you an understanding
why EDW needs tons of manpower to support it and why CMS data warehouse needs
half an FTE (full time employee) to support it.
Further, EDW folks can talk to CMS
folks to get a handle on what are the different things CMS team did to get to
where they are.
Finally, if EDW team starts working
on the betterment of the product, they can use two snapshot of this graph – the
first one in the present time and the next one a quarter or two later to
evaluate progress (hopefully) that the product has made on the two determinant
attributes.
Love to get feedback.
Monday, September 2, 2013
Development, SE and SRE teams - why all of them are critical?
Have you ever wondered what happens when you have a very
motivated team that is very wrong for a given job? The team works extremely
hard, slogging hours and clocking tons of time, killing themselves over
weekends and finally comes up dissatisfied with what they have (non)achieved. In
other words, square peg in round hole. Sounds familiar? Read on.
This case study is for service engineering team in any
company of 1000 people or more. In the industry, service engineering team
typically sets up all the framework to take the developer’s code to production.
This involves setting up robust CI/CD (Continuous Integration/Continuous
Delivery), monitoring, automating some parts of Dev team provided engineering
and QA tests, post-deployment smoke tests and full blown monitoring framework
for all alerts around the code.
SE and SRE Teams
Most organizations have SE and SRE teams in a combined single team. They may chose to call it SE or SRE. But make no mistake, this team has two different and very conspicuous flavors – engineering and
operations. Like I said earlier, most teams have both the flavors built into one single team. That
implies that the same team will have folks with great engineering competence
and those with operations bias as well. However, in some companies, especially
the larger ones, the two flavors may be two very different teams working
separately under different leadership for common goals as stated above.
In some
places, the engineering focused team is called DevOps and the operations team
is called SRE. Yet other companies name the engineering focused team as Service
Engineering team and operations team as just operations team.
In Yahoo, we have engineering biased team as Service
Engineering team (SE team) and operations focused team as Service Reliability
Engineering team (SRE team).
When the teams are created ab initio, the work is segregated and defined for each team. The
two teams are also seeded differently – engineering focused team will have more
people who can code, understand the code, get into innards of the code base and
file bugs when we hit issues due to buggy code. They almost tell the developers
“here is where your code is throwing an exception, please fix this part”. So
they “can read” and “understand” the code but since they do not “own” the code,
they hand off the bug resolution to developers.
Then we have the SRE team which is our first and second line
of defense and mostly attends to all the alerts, provides first level
investigation and triaging and either resolves them or escalates them to
service engineering team. In a very matured SRE team, we expect 85-90% alerts
being handled and resolved by SRE team. The 15-10% alerts that are escalated to
SE team are mostly resolved by SEs. You can expect 1-2% of those alerts being
escalated to development team.
If you look at the work, SRE work is totally interrupt
driven, SE work is partially interrupt driven and large part is planned work.
The developer’s work, on the other hand, should be largely planned so he or she can totally focus
on the new features, new products and enhancements etc.
It is possible that over a period, the teams may morph into
something better – at that point, we say “oh, this team has really matured into
a fantastic SRE or SE or development team”. That is mostly possible if the
teams are doing the type of work that they have been designed to do and in the
manner (interrupt or plan driven) they have been conceptualized to do. So this is
good scenario, eh?
When things start
going awry….
What happens when the scenario doesn’t turn out to be as
good as we wanted it to be or as favorable to each team as we would have wished
for? Well, then we have a challenge….
If we are not continuously monitoring our teams for type of
skill sets that seed these teams, the type of work that falls in their laps,
it is very possible that the fiber of the team(s) may undergo a mutation –
typically, for worse.
Imagine a scenario, we have attrition due to any number of reasons in SRE team. It could be leadership or lack of it, lack of good management, gaps in people’s expectation, company not doing well, work load being pure killer…any number of reasons. And as a organization, we fail to see this coming, even after it happens, we do not backfill attrition immediately or fast enough, the workload on remaining people will continue to increase since attrition of people doesn’t necessarily translate into reduction of workload. So, the remaining workforce comes under resources crunch and work overload. This then starts a downward spiral that if not arrested well and fast enough can pretty much cause annihilation of SRE team. Once SRE team reduces without proportional reduction in the workload, we start spilling workload to SE team. SE team now suddenly discovers, much to its angst and disappointment that it is the de-facto team doing SRE work while expectation around SE work have not diminished at all. So SE team starts focusing on totally operational work and bends backward to make the Site stay up.
Imagine a scenario, we have attrition due to any number of reasons in SRE team. It could be leadership or lack of it, lack of good management, gaps in people’s expectation, company not doing well, work load being pure killer…any number of reasons. And as a organization, we fail to see this coming, even after it happens, we do not backfill attrition immediately or fast enough, the workload on remaining people will continue to increase since attrition of people doesn’t necessarily translate into reduction of workload. So, the remaining workforce comes under resources crunch and work overload. This then starts a downward spiral that if not arrested well and fast enough can pretty much cause annihilation of SRE team. Once SRE team reduces without proportional reduction in the workload, we start spilling workload to SE team. SE team now suddenly discovers, much to its angst and disappointment that it is the de-facto team doing SRE work while expectation around SE work have not diminished at all. So SE team starts focusing on totally operational work and bends backward to make the Site stay up.
During this time, SE team has also changed their work
routine as follows so they can accommodate the operations workload that has
been thrust on them:-
- Stops going to development team’s daily scrum meetings since SE was up fighting operations and incident late last night, during weekends and long weekends
- Doesn’t have time to do code review with dev team
- Doesn’t have time to build monitoring new feature that got pushed last evening through CI/CD pipeline
- Backlog of the SE related work starts building up
Slowly but steadily the SE team becomes the new SRE team.
Management and leadership don’t really mind it – they cut the cost down in operating
expenses by dismantling a full team that was called SRE team and in their minds
and words, they have made the SE team very “efficient”.
The management is so focused on dollars that it misses the deep,
dense forest for few “shinning” trees.
The whole change takes place over at least a year, it can’t
happen over few months.
The management is applauded and rewarded for cost cutting
and the “success stories” are told and exchanged with other teams. No one yet
understands the deeper damage this cost cutting and change has done to the SE
team. By the time people and management will realize this, the current
leadership of management would have long moved to different role, different
company, and different team to continue the good work there.
Now let us bring our focus back to poor SE team that has
been forced to morph into an SRE team. There are some very brilliant engineers
in the SE team who are not happy with the current state of affairs and are
waiting for management to put them out of their misery by recreating the SRE
team. When they realize that management is not even thinking on those lines –
of recreating SRE team, reinvesting in the SRE people - they make their mind and jump ship. Jump ship to different team, different company, anywhere
but their current team.
Now the next phase kicks in, the SE team starts seeing the
same attrition that SRE team saw – reasons may be the same or different – but good
and brilliant team members are first to leave. The immediate management of SE
team is suddenly running around like headless chicken, trying to do firefighting
by getting enough resources so Site can be kept up. In their rush to get any
and every resource they can find, they naturally lower the hiring bar.
Once they lower the hiring bar, the once brilliant and
industry recognized SE team starts hiring sub-standard material for that team.
Please be aware that the new hires are not bad or incompetent people. When I say "sub-standard" it doesn't mean that they are incompetent. All I am saying is that they are not the right fit for the SE team. They may
be pretty hard working but are ill-suited for the SE team which was until then
seeded by brilliant engineers who fully understood how to take very "developer" code and change it into a very "production ready" code.
Now, this is where it gets interesting. In the first phase,
we lost SRE team. In the second phase, we forced the SE team to become SRE and
SE team combined into one. In the third phase, we made the SE team to change
totally into SRE team. In the fourth phase, we started losing SE team. In the
fifth and final phase, we hired and seeded SE team with different level of people.
…here is the kicker, the SE team that started operating like
an operations team is at its lowest morale since the workload is totally
interrupt driven, they have by now lost the respect of their development team. At this point, development team pretty much agrees that SE team doesn't do any level of
investigation on any issue before chucking it over the fence to them.
…And the disease
spreads to Development team as well….
So now, this is perhaps that last stage, the development team changes
its workload from being totally plan driven workload to substantially interrupt driven workload. At this
stage, a development team that was entirely focused on new products, new
features is now forced to change its focus to part new features/product and
part sustenance of existing products or site up. A development team that was
able to bring to market at least two big products a year is now struggling to
bring even one big product in beta phase.
The slow development team frustrates their management since
their management is trying to catch up or stay ahead of competition. As a result,
they are continuously changing roadmap and plan of record.
In the past, the development team used to complete a big product in 4-6 months, which used to allow their management to do course corrections rapidly. Now, the course corrections have to happen at the same pace as earlier but imagine that a development which is moving a very slow pace, same team is now forced to absorbed course corrections while their beta version is also not put out. This results in what development team largely sees as "scope creep" on the given project. This frustrates the developers and they understand this as “directionless” development team management.
Now the maladies and issues of SRE and SE team have become
contagious and started hitting development team as well. Developers, frustrated
by their management’s constant change of direction, start leaving causing a
drain even bigger than the SRE and SE team attrition.
At this point the whole organization is paralyzed by these issues
and starts slowing down to the extent, that at some point, it comes to a
grinding halt. At this juncture, all the teams are focused on keeping the site up.
How do we rebuild
from here?
First thing we need to do is to baseline our team to estimate the "damage" - to ascertain how much our team's bias has changed.
To measure where an SE or SRE or Development team stands, we can plot all the
dimensions required for a good team - SRE, SE (with engineering bias) or Dev team on X axis and then measure them on a scale of 0 through 10. Zero on the scale
shows total absence of the specific dimension and 10 shows reasonably high
proficiency in that dimension.
For the purpose of this article, I will focus only on Service Engineering team.
Let us also assume that hypothetically a very mature Service Engineering team in the industry will perhaps be at 7.5 and above.
Let us also assume that hypothetically a very mature Service Engineering team in the industry will perhaps be at 7.5 and above.
There is a distinct difference between Service Engineering
team as well as Service Reliability Engineering (SRE) team. Both are equally
important for a company. At the risk of being shouted down by many, I would say
that for a company, SRE team is more important than SE team. I draw the
metaphor of a hospital. Every hospital has an Emergency Room or ER. Some places
also call it Trauma center. This place receives people who are in dire need of
immediate first aid else they would die. They receive all the accidents, heart
attack, gun violence related people… They are America’s life line and the first
line of response. Without these wonderful folks we would have hundreds of
thousands of additional causalities in US every year.
Then there is a medical system that does more of diagnostic
and preventive medication. These are also the people for whom every day is a
“Monday” – they don’t have holidays,
These are the guys who save us daily.
Similarly, SRE team is our first line of defense. These are
the guys who receive the alerts and respond to them immediately. Depending on
how egregious an alert is, and how critical a property is, their response may
vary. For example, in case of a DoS attack, they may start and IRC, collaborate
with other companies having the same challenge and do everything to repel the
attack. Actually, discussion on DoS will need a separate book by itself. LOL!
SE team is the medical system that has much more time than the ER or SRE team and therefore, can focus on addressing the causes as opposed to just the symptoms.
Engineering-Operations
Graphs or EO-factor
I call these graph Engineering-Operations graph or “EO factor”
for short. This is like pH factor that determines if a solution is acidic or
basic. The pH factor of pure water is 7 and is considered neutral. pH factor
above 7 is considered alkaline or basic and as pH factor increases beyond 7,
the basicity or alkalinity of the solution increases. Similarly, as it goes
below 7, the acidity of solution increases.
EO factor should be read in the same way, as we move away
from the “Operations Line” the team becomes more biased and focused on a given
track – operations or engineering. As
you move north of this line, the team tends to become very engineering focused.
In the same vein, if you move south of this line, the team has more of operations
competence.
This graph can be used by any team with different
dimensions. For example, an SE or SRE team working on Big Data systems will
have somewhat different dimensions than a team working on Mail or a team
working on company landing home page. It is entirely up to the managers to
figure out correct dimensions to measure their teams and use those dimensions
to then chart out the future course.
 |
| EO Factor |
Build the new team...
Once you have ascertained the baseline, take remedial steps to rebuild it - slowly and steadily.
Seed it with right skill set, keep the right workload type, see to it that it comes in right manner - interrupt or planned, keep irrigating and feeding it with right talent. And above all, watch it carefully as shown below.
Watch the team's focus...
Let us take a scenario where I have EO factor for a team and the team exists for a long period. You are interested in seeing how that team either stays in the fiber that you created it for or if, over a period, it has changed its bias. A time series trending will be great graph to have for this type of trending.
Once you have ascertained the baseline, take remedial steps to rebuild it - slowly and steadily.
Seed it with right skill set, keep the right workload type, see to it that it comes in right manner - interrupt or planned, keep irrigating and feeding it with right talent. And above all, watch it carefully as shown below.
Watch the team's focus...
Let us take a scenario where I have EO factor for a team and the team exists for a long period. You are interested in seeing how that team either stays in the fiber that you created it for or if, over a period, it has changed its bias. A time series trending will be great graph to have for this type of trending.
 |
| EO Factor Trending |
This time series helps us to understand how our team is
trending over a period. Remember, no side is good or bad in this graph. You
want to keep a good watch on your team’s tendency to shift its bias from
Operations to Engineering or vice versa. Depending on what bias the team was
intended to be seeded with, you have very compelling motivation to keep the
bias in the same side. If you are not watchful and very mindful of this, the
teams always have tendencies to move from one focus to the other.
We should ensure that we seed an SE team so that it has an
EO factor of about 6 or above. We have also got to ensure that this EO factor always
stays above that for that SE team. Similarly, we need to ensure that our SRE
team has EO factor below 5 or 5.5 so it keeps operations as their bias.
An SRE team can be seeded with very brilliant engineering
focused people as well. The challenge is that most likely the brilliant people
do not like operations work and may again start rolling the same juggernaut
which led to the attrition of SRE in the first place.
Conclusion
We need to be always aware and cognizant of type of talent pool
in every team and make sure that right team is staffed for doing the right and
intended job. This has to be consistently and continually monitored else we get
to a point where we need to make radical changes. Making changes and having
those changes make impact is multi-year project and therefore, painfully
slow. Hence, a stitch in time may act as
a preventer for nine few years later.
Subscribe to:
Posts (Atom)